
Two Mosconi Cup Match-up Predictions
- December 1, 2020
- Damian
- Analytics, Metabase, Mosconi Cup, Pool Metrics, Pool Stats, Posts, Sabermetrics
- No Comments


Here are the two models we had time to run with data we felt comfortable with for two probable match-ups during the 2020 Mosconi Cup.
If you’ve followed our previous posts then you may be aware of these metrics we have created. Nevertheless, an overview of the Metrics to Consider are as follows
DSR: Defensive Success Rate. This metric measures a player’s ability in safety play. It illustrates how effective a player is at forcing an opponent miss or foul after playing defense. The maximum DSR is 200 and represents twice the value of each defensive shot – in other words causes his/her opponent to foul after every defensive shot they play. This is highly unlikely and only is a theoretical value. A value of 100 means that a player either forces a foul or a miss for each safe play. Again, not too realistic, but on small sample sizes it does occur. Generally, a very effective DSR is around 66.66 or above for professional level players
SA: Shot Aptitude. This measures the players ability to shoot effectively and decisively. Time is of the essence and those that are more decisive can be represented in this metric. Other factors considered in this metric are shot difficulty and rate of made, miss, defensive, and foul shots.
CSP: Clutch Shooting Percent. This is a derived math formula invented by us also. This measures the ability of a player to perform in the clutch. That is how well a player performs while the game is in question. The complexity of the formula can be found in a previous post here and on our website. It is calculated directly within our Pool Stats Pro app, and an overall is computed on our web interface.
B&R: Break & Run Percent (9-ball). This is simply the rate a player runs the table after they broke on the current rack. The values are for the data we have collected thus far.
TWP: True Winning Percent. This is the player’s true game winning percent as measured by the data we have collected.
We
can’t wait for the Mosconi Cup this year. Keep a look out for us
providing stats as fast as we can on the singles match-ups during the
tournament. Enjoy!
Notes: We feel comfortable with our models. These models were created based on historic match-ups between the players involved. As more data becomes available, the models will reflect accordingly. The models are based off the model used in American Baseball, called the Pythagorean Win/Lossand has been proven to be accurate, once fitted to the data, within a few percentage points.
You might also like:-
-

Live Stats Coming Soon
-
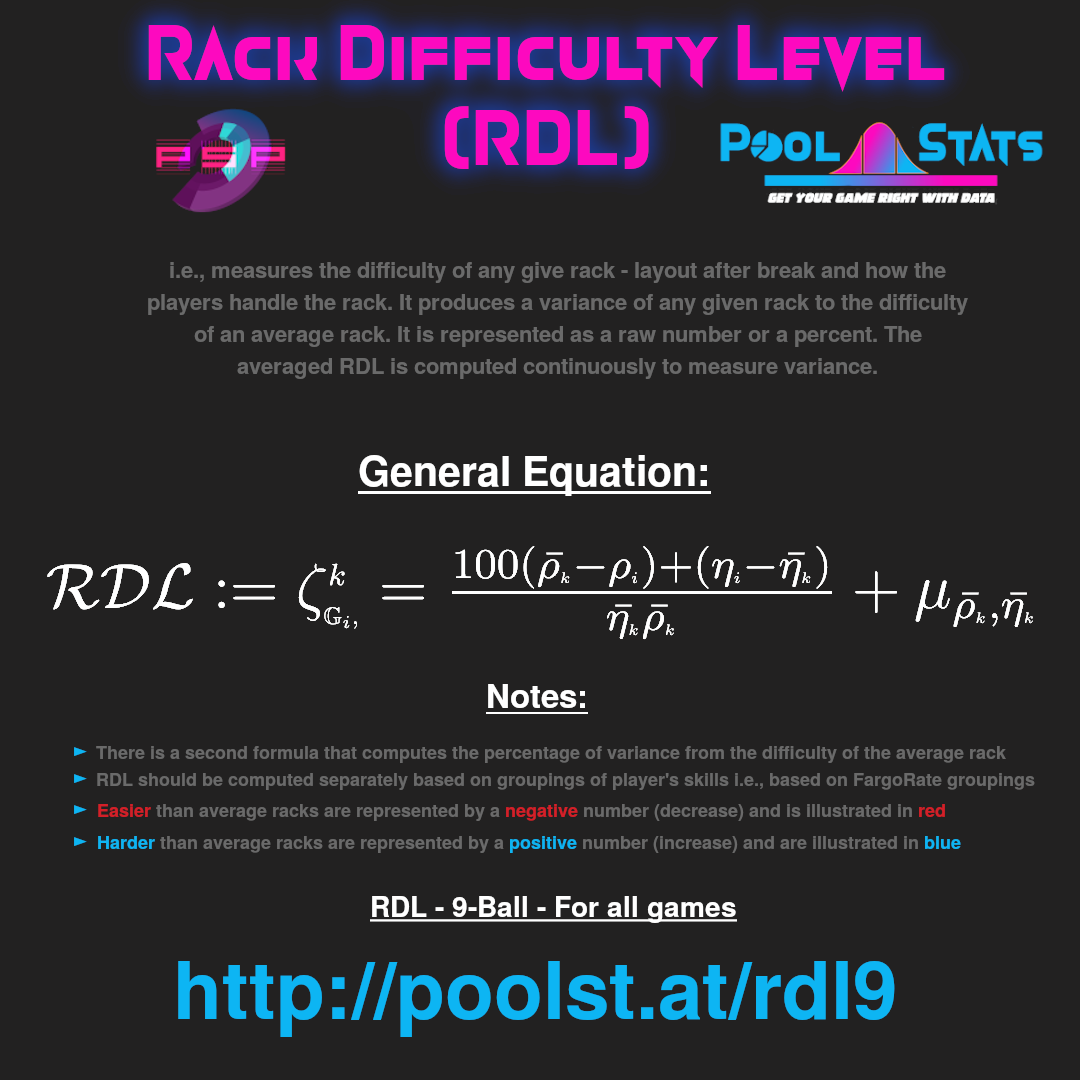
Rack Difficulty Level (RDL): Understanding the complexity of a rack after the break
-
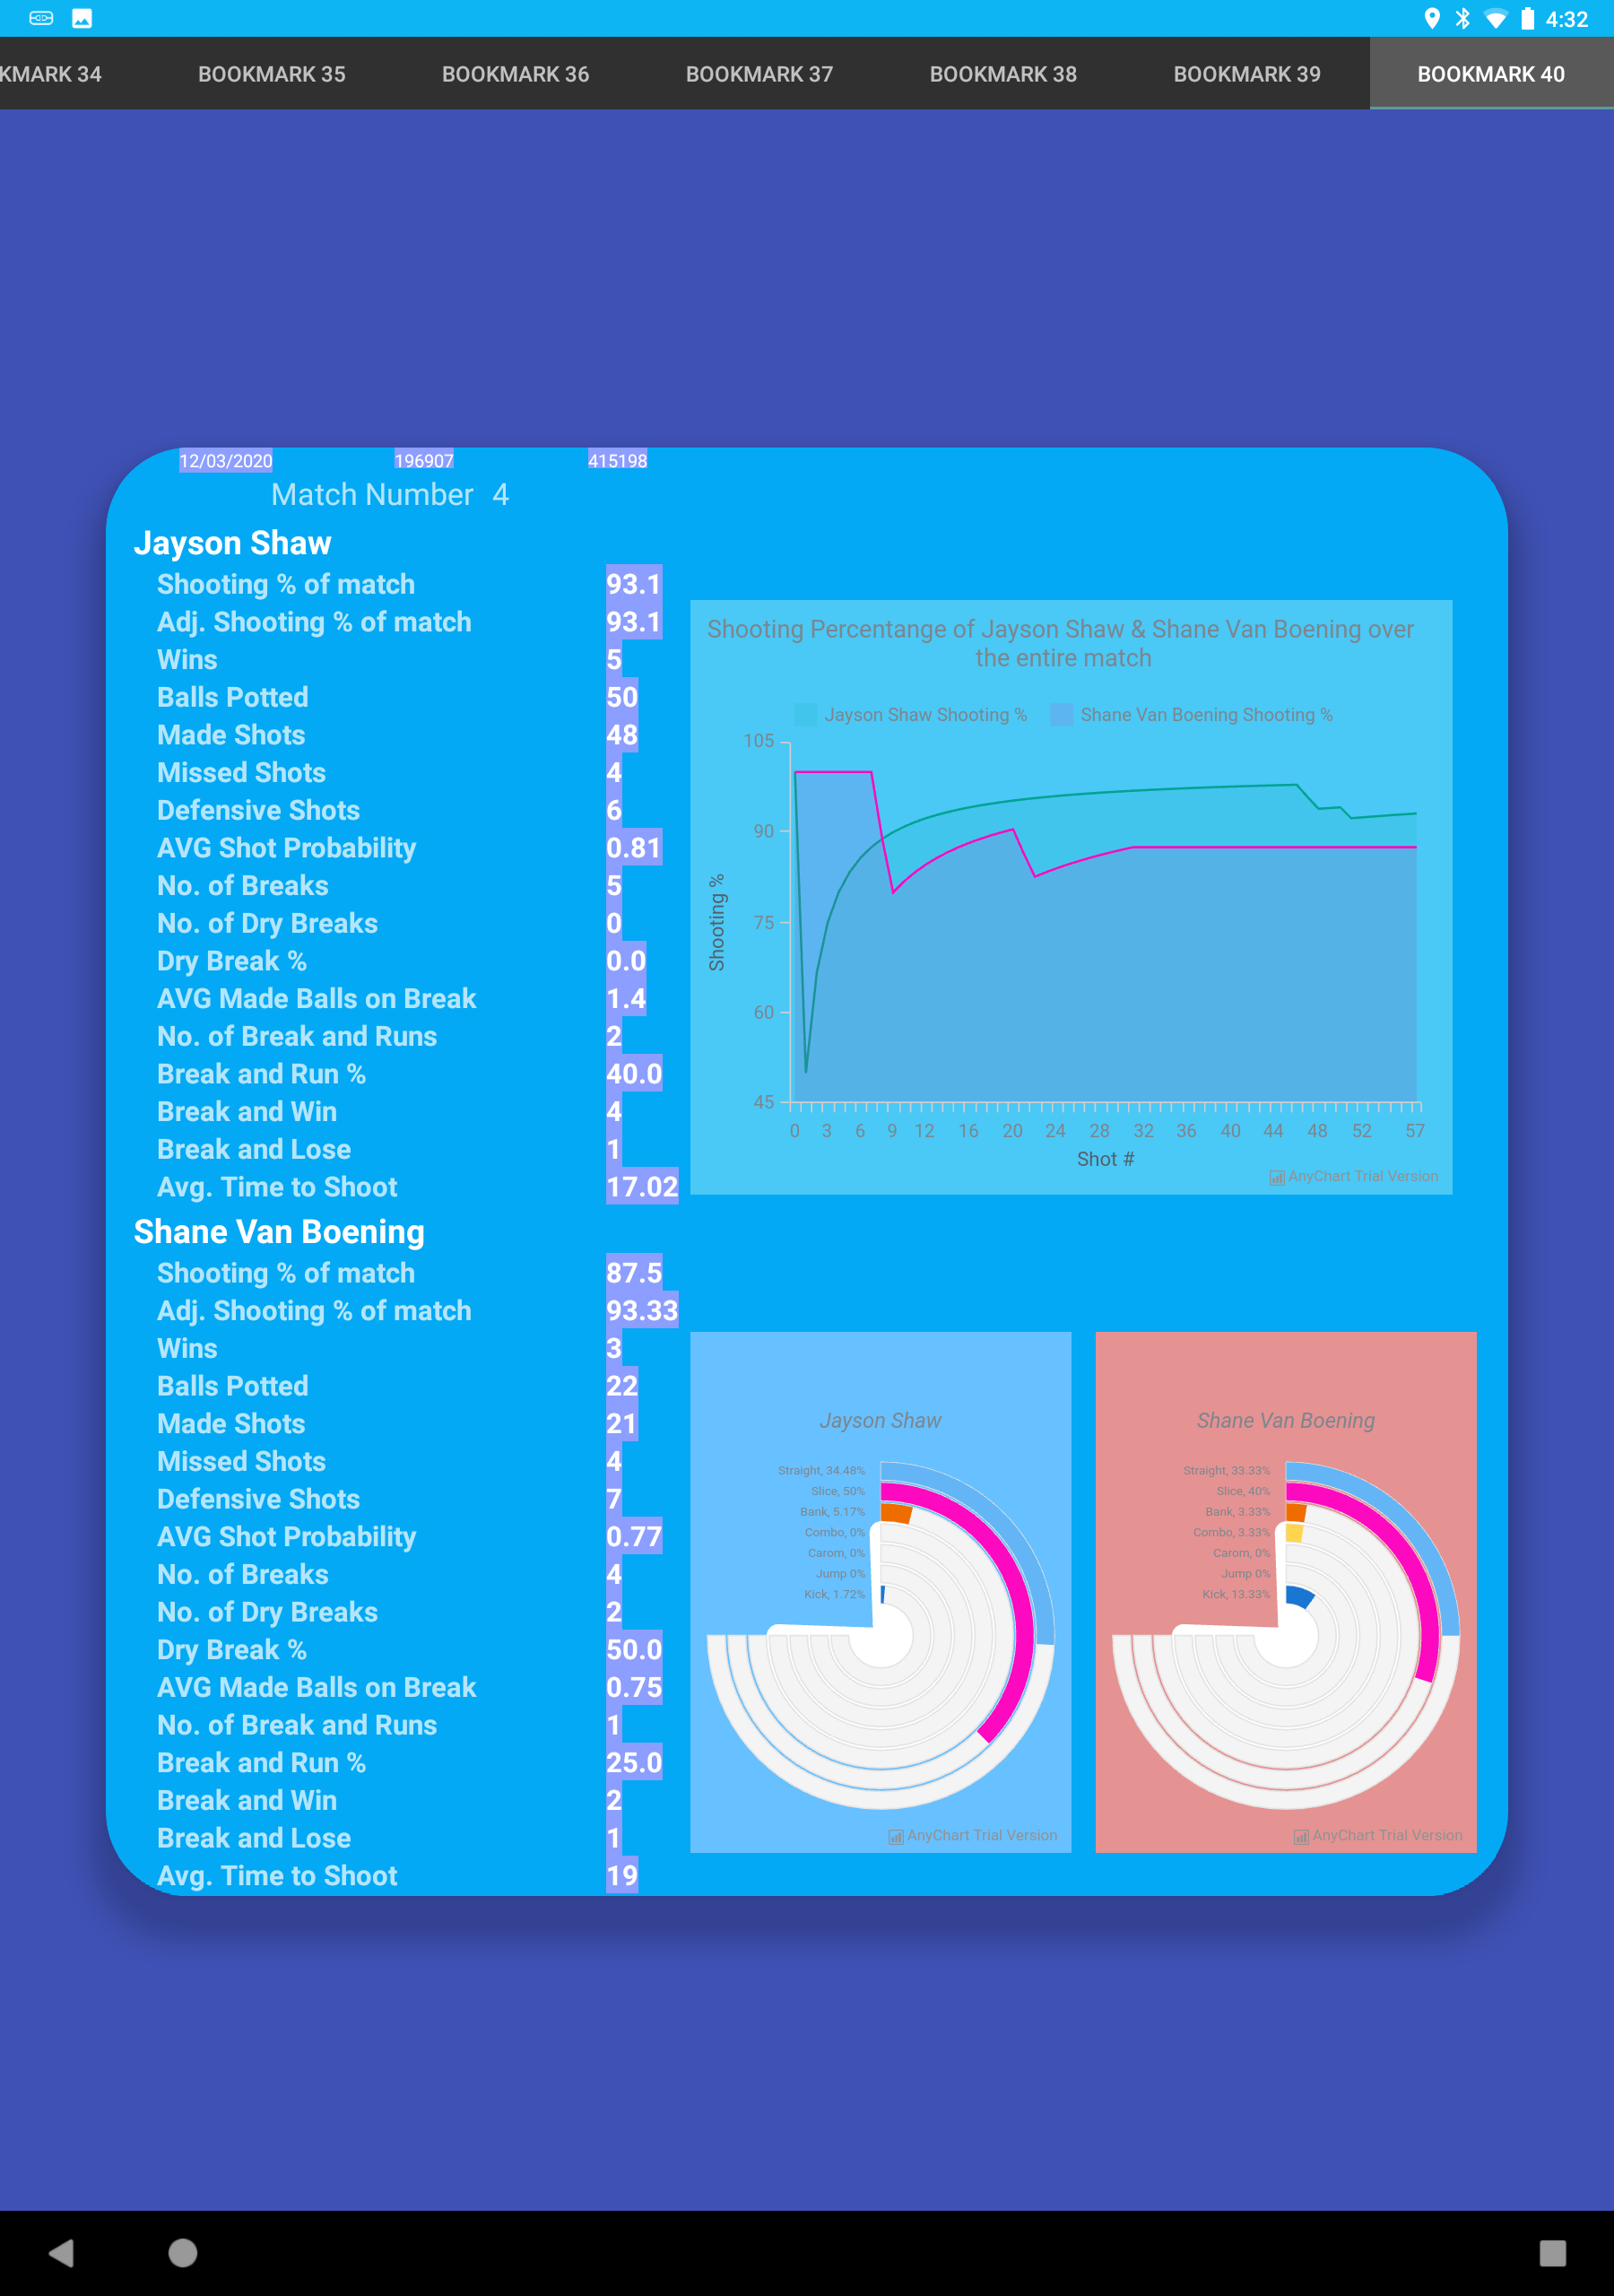
Pool Stats Pro v1.6 Released
-

Michigan Leagues Get FREE Access
-

Introducing our Loyalty Program
-

Pool Stats Co-Founder Interviewed on the Podcast Chalk is Cheap
-
Pool Stats Pro v1.2.0
-
On the Quasisubjectivity of Pool Stats Data Collecting
-

Clutch Shooting Percent: Formal White Paper
-
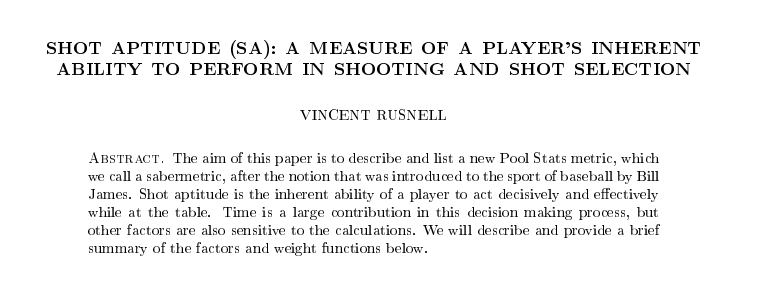
Shot Aptitude White Paper


