


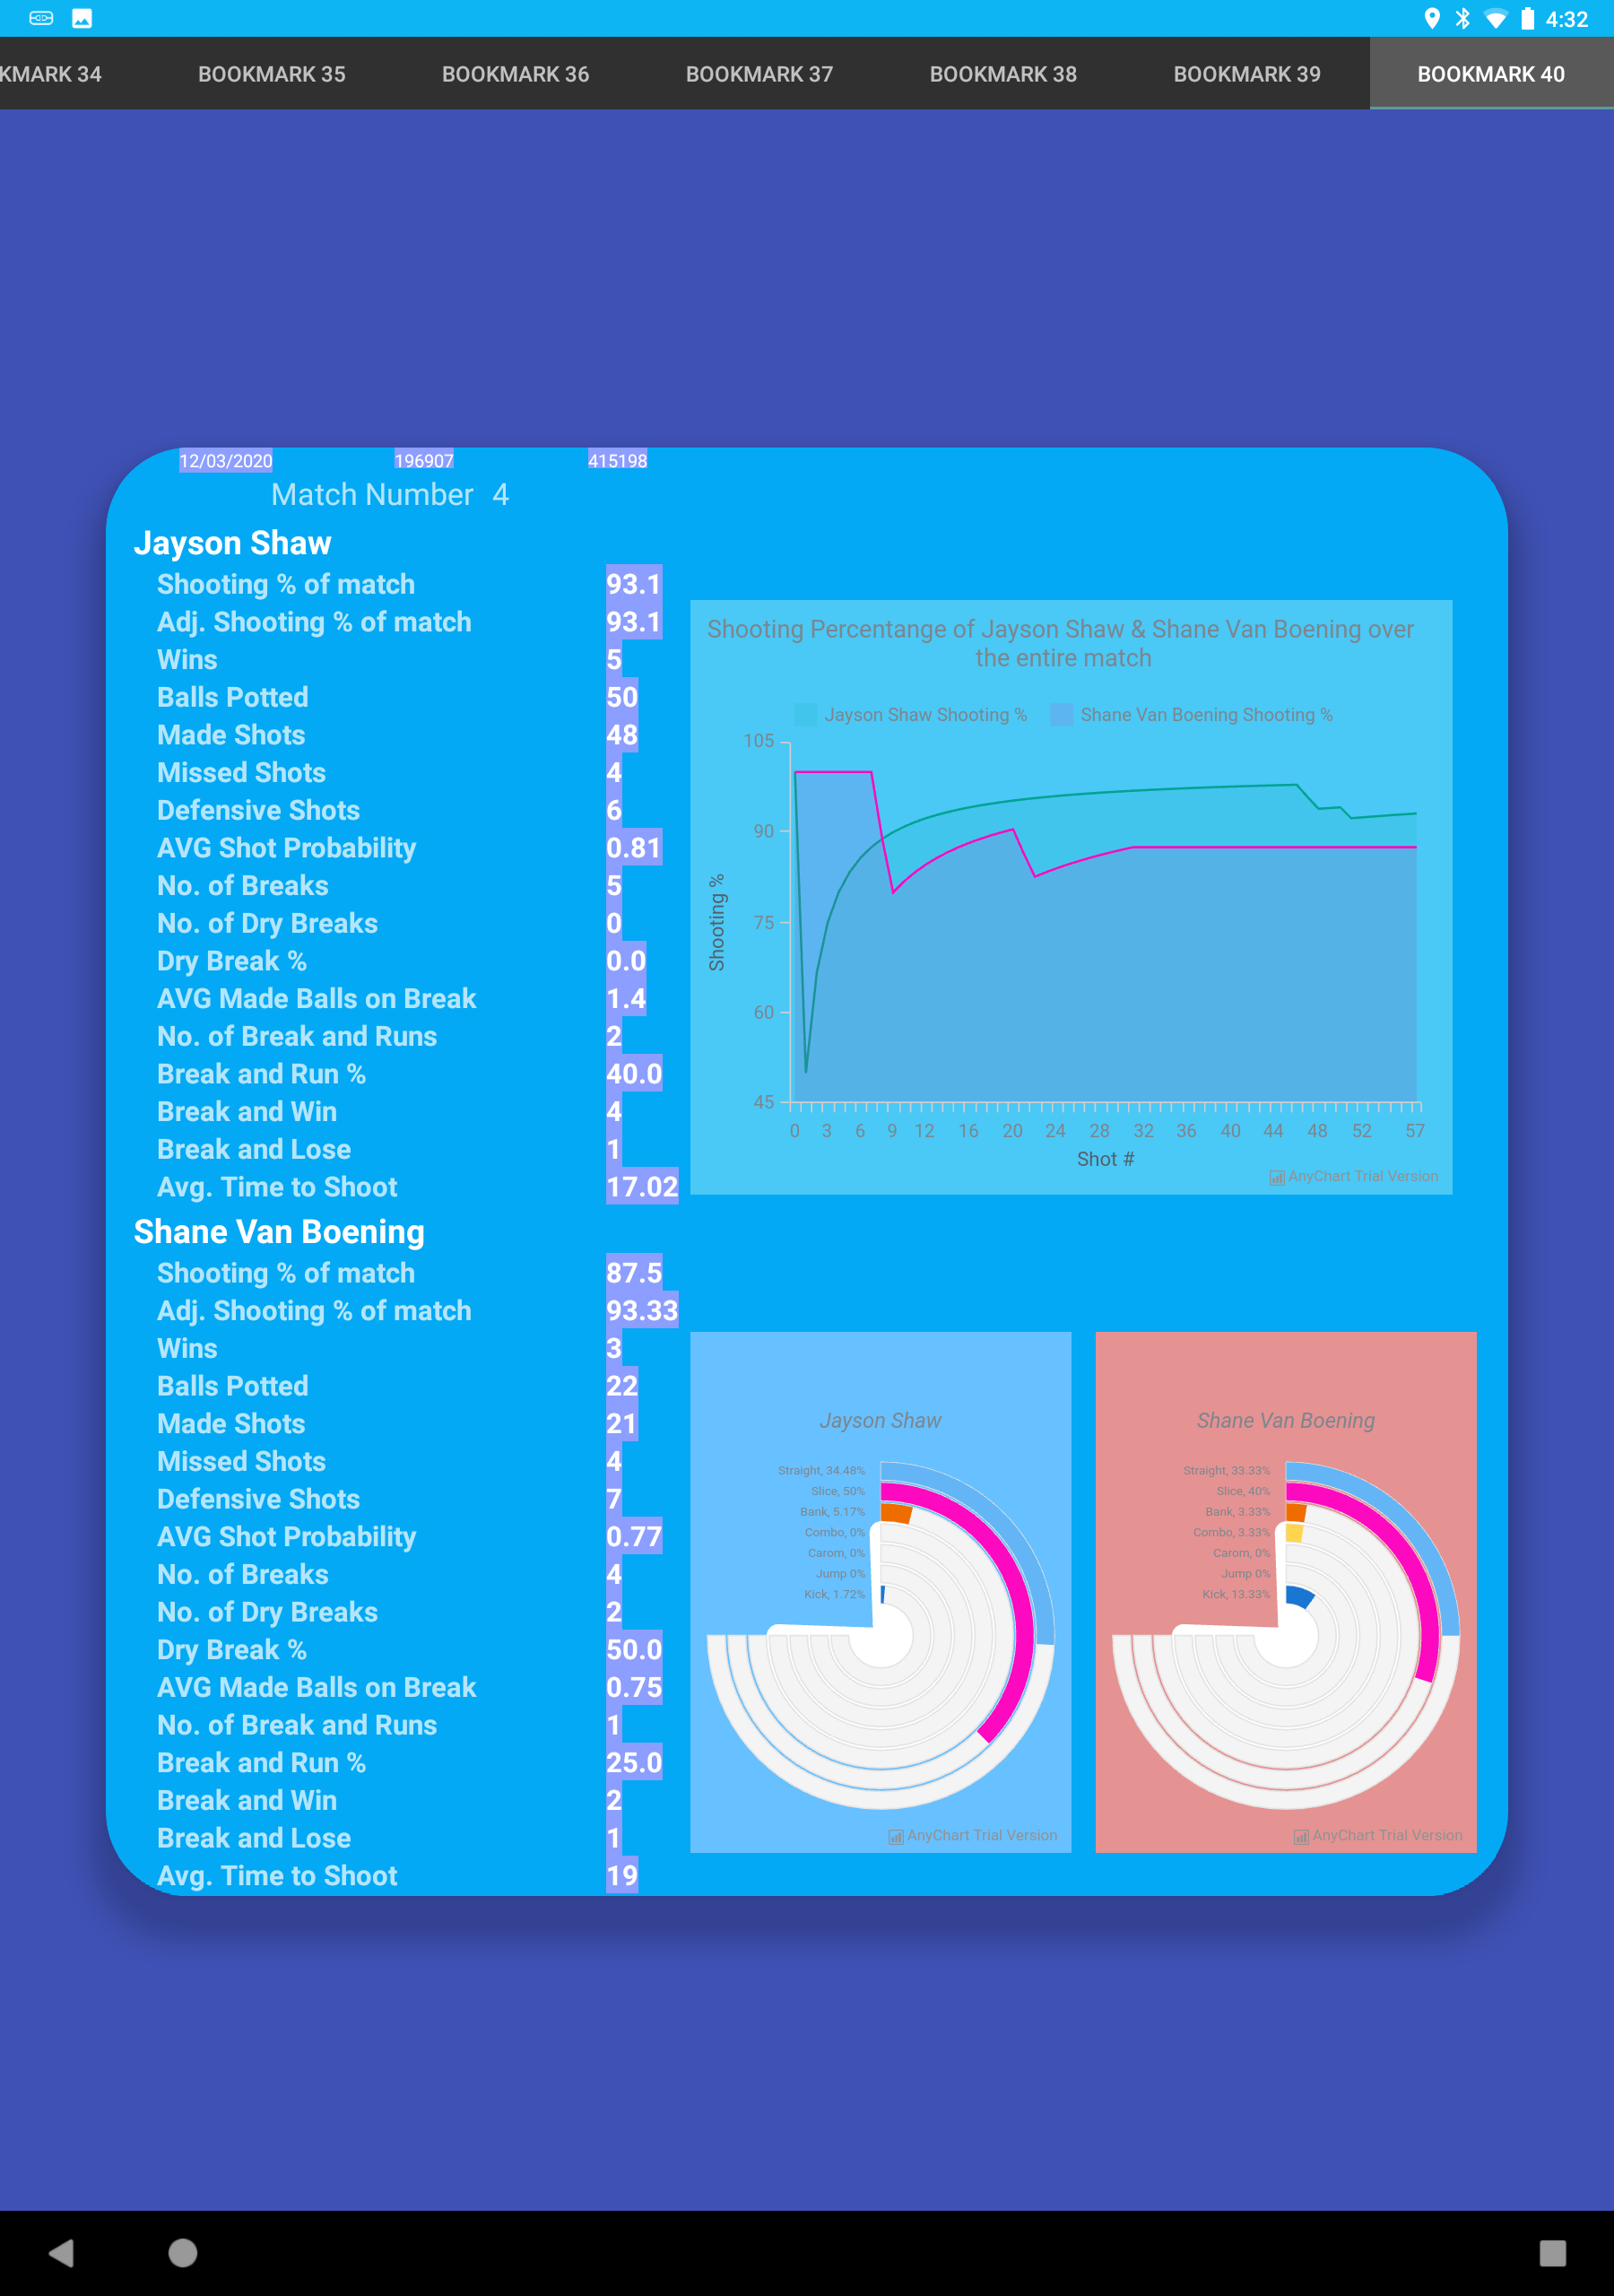
Data Visualization Dashboard Example
Here is a quick example of the things you will be able to do with our Metabase Data Visualization dashboard linked to the Pool Stats Pro App Data. This is take from a sample database and the user of the Pool Stats Pro App has the ability to create their own metrics and graphs from the data saved in their app – which gets uploaded to the server.

You might also like:-
-
Pool Stats Pro v1.6 Released
-
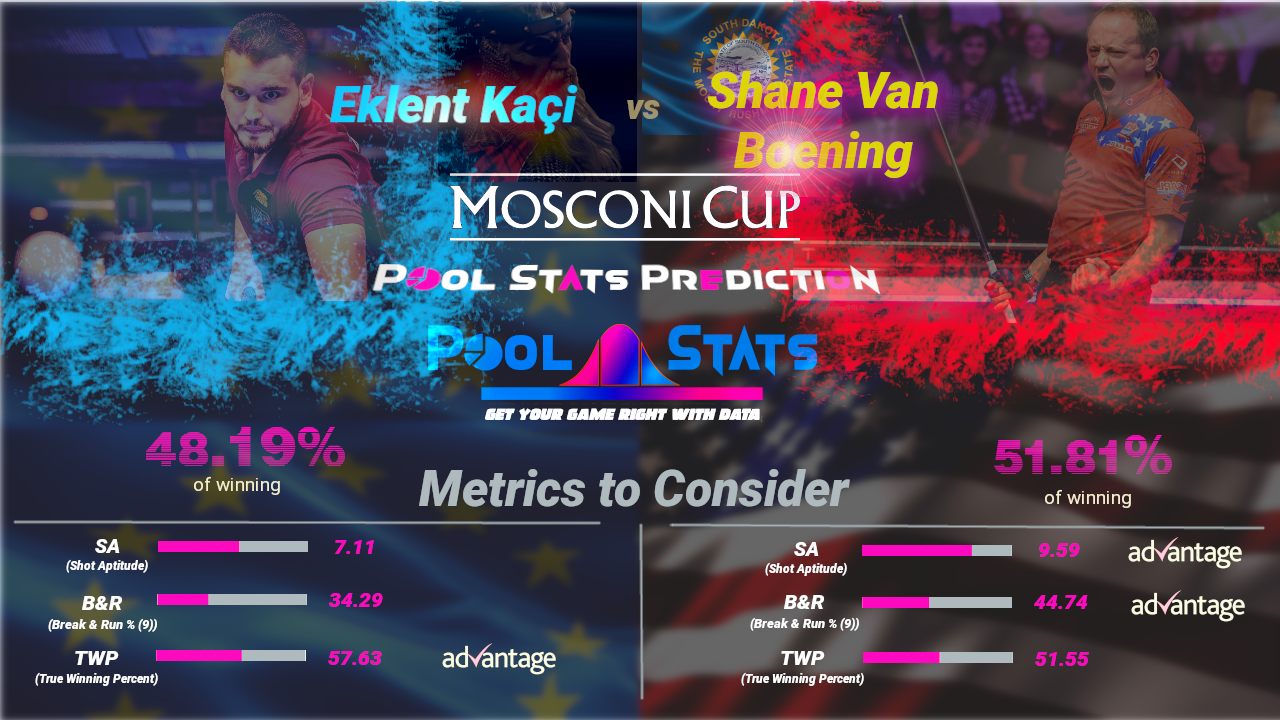
Two Mosconi Cup Match-up Predictions
-
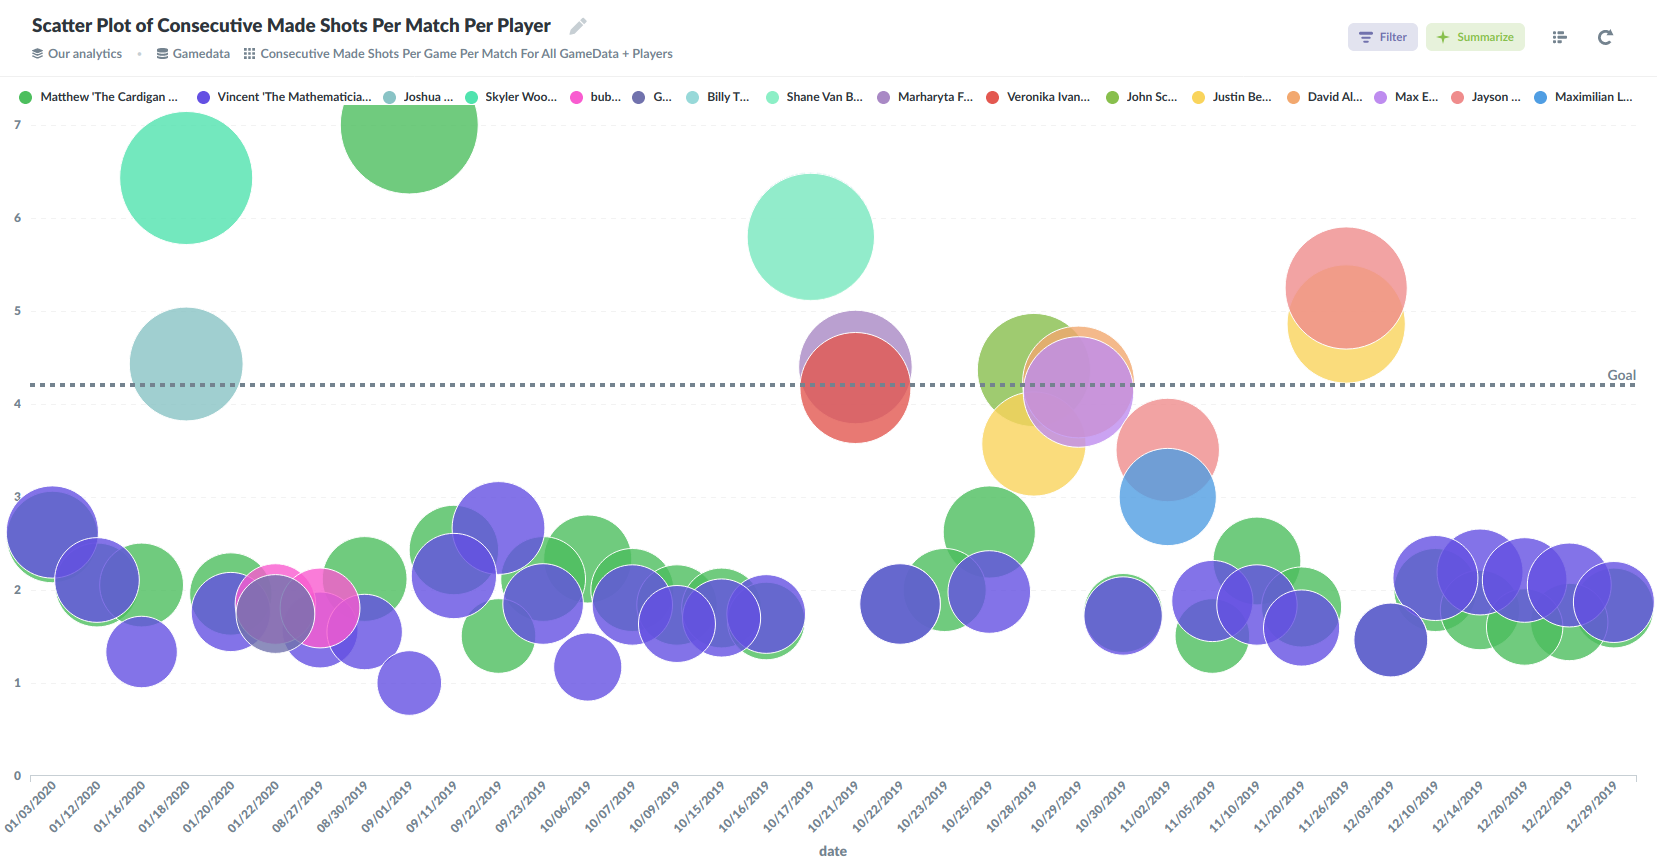
Average Consecutive Made Shots Per Match For All Players Recorded
-
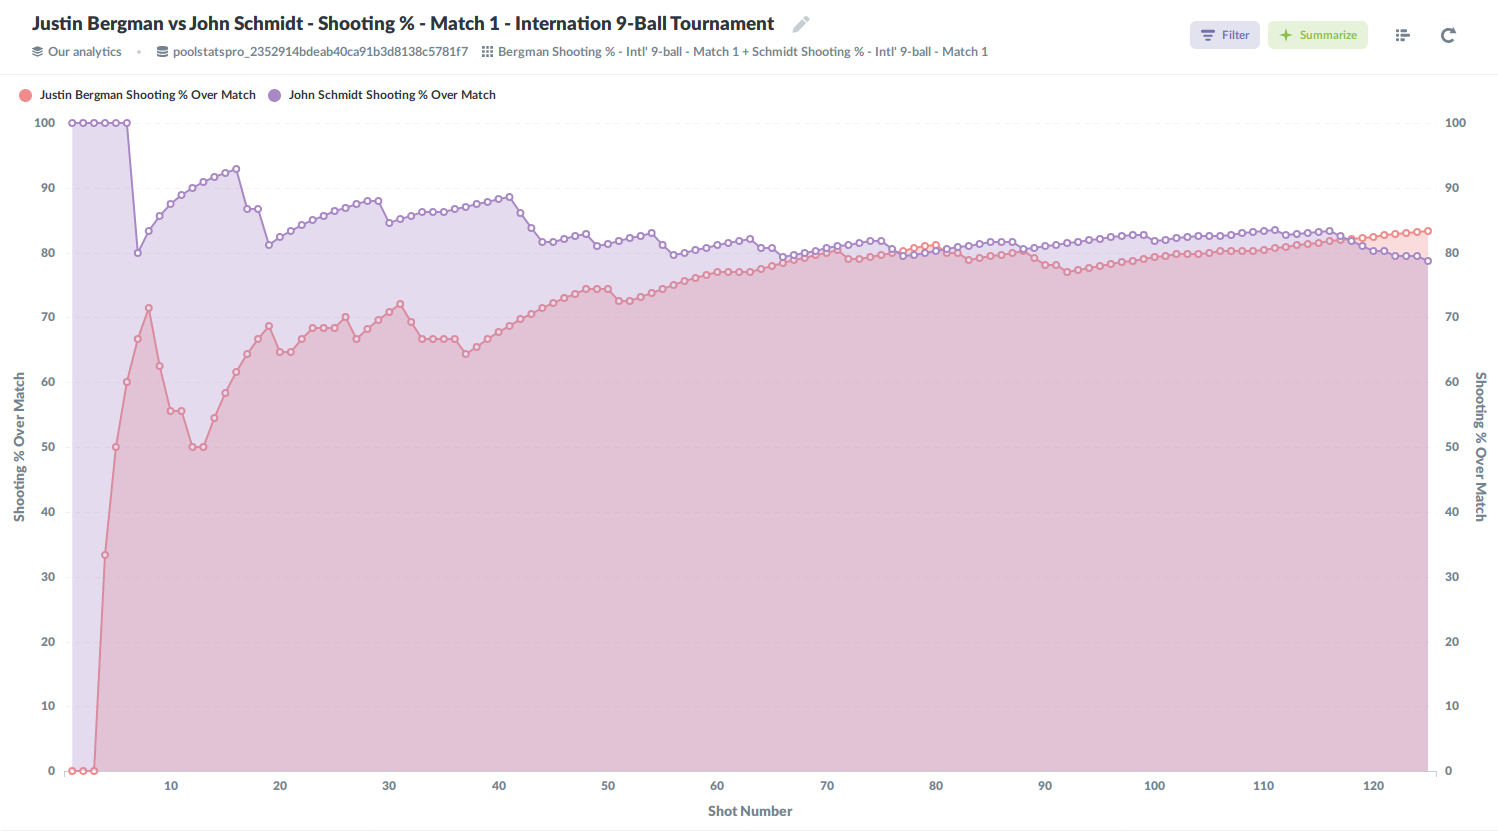
Dashboard Visualization of Justin Bergman’s Shooting % During Match 1 of the International 9-ball Open
-
2019 CBSA Taishun 9-Ball International Open│Veronika Ivanovskaia vs Marharyta Fefilava
-
New Release Date
-
App Release Date Pushed Back
-
Pool Stats Pro App


